
The $2.17 trillion headline is everywhere right now, and it tells you almost nothing useful. The number that actually matters—the one with real consequences for automakers, dealers, and your next vehicle purchase—is buried three paragraphs into most of those reports.
The Number Everyone’s Quoting—and the One That Actually Matters

Fortune Business Insights projects the global EV market will grow from roughly $1.03 trillion in 2026 to $2.19 trillion by 2034—that’s the figure flooding automotive news feeds, and it’s genuinely significant. But if you’re trying to understand what’s actually happening to the car industry, the dollar projection is almost a distraction.
The more consequential number for legacy automakers is the market-share trajectory. Multiple independent forecasting firms are converging on EVs claiming more than half of global new-car sales somewhere between 2033 and 2035—less than three full model cycles away. That’s not a distant technology story. That’s a product-planning crisis unfolding in real time inside every traditional automaker’s boardroom.
Whether you’re deciding when to buy, which brand to trust long-term, or simply trying to understand why every automaker suddenly sounds panicked, the electric vehicle market growth trajectory is the story worth following.
What the Forecasts Actually Say—and Why They Disagree

If you’ve seen wildly different numbers cited for the EV market’s future size, that’s not bad journalism—it’s genuinely inconsistent methodology. Here’s what the major sources are actually measuring:
- Grand View Research puts the market at a dramatically larger figure because it uses a broad definition that folds in commercial vehicles, charging infrastructure, and software revenue streams alongside passenger-car sales.
- Fortune Business Insights tracks a narrower vehicle-sales figure: $1.03 trillion in 2026 growing to $2.19 trillion by 2034. For a car buyer comparing purchase options, this is the most apples-to-apples reference point.
- Statista projects over $1 trillion in EV market revenue for 2026—a figure that diverges from competitors partly because of differing geographic scope and whether used-EV transactions are counted.
- Alt Energy Magazine cites forecast data suggesting EVs could represent close to 60% of global new-car sales by 2033, one of the more aggressive timelines in circulation.
The practical takeaway: stop trying to reconcile the exact dollar figures across sources that aren’t measuring the same thing. Watch the market-share trajectory instead, because that’s what forces automakers to make real decisions—about platforms, capital allocation, and which products actually get built.
The Sales-Share Timeline That Should Keep Detroit Up at Night

BloombergNEF’s Electric Vehicle Outlook projects EVs—including vans and trucks—surpassing 50% of global new-vehicle sales around 2035. Other forecasters, including those cited by Aftermarket News in their global EV market analysis, place the 50% crossover somewhat earlier, in the 2033 range. The precise year is debated; the direction is not.
Legacy automakers typically need five to seven years to fully retool a platform from the ground up. If the 50% sales-share threshold arrives anywhere between 2033 and 2035, any brand without a credible, high-volume EV lineup shipping by 2027 or 2028 is structurally late—not slightly behind, but late in a way that affects dealer margins, brand perception, and long-term survival.
Who Wins, Who Loses: A Straight Look at the Competitive Landscape

Not every automaker enters this window from the same position. The competitive reality breaks down roughly like this:
| Brand / Group | EV Platform Status | Key Advantage | Key Risk |
|---|---|---|---|
| Tesla | EV-native from inception | Software depth, Supercharger network, margin structure | Brand polarization, intensifying competition |
| BYD | EV-native, vertically integrated | Battery cost control, China volume, rapid global expansion | Regulatory barriers in U.S. and EU markets |
| Volkswagen Group | MEB platform, scaling | Volume manufacturing capability, brand breadth | Software development delays, cost overruns |
| Hyundai-Kia | E-GMP platform, committed | Early capital commitment, competitive pricing | U.S. manufacturing footprint still building out |
| Ford / GM | Mixed—EV lines alongside ICE | Dealer network depth, brand loyalty | Legacy cost structure, pension obligations, dual R&D spend |
| Stellantis and others | Compliance-level in key segments | Existing dealer relationships | No EV-native cost structure, widening software gap |
Tesla and BYD don’t carry the legacy pension obligations, dealer-network friction, or parallel combustion R&D budgets that weigh on American and European incumbents. Volkswagen Group and Hyundai-Kia committed capital and platform architecture early enough to compete on volume by 2026 to 2028—they are credible challengers. Brands still treating EVs as compliance cars—low volume, poor charging integration, no meaningful over-the-air update capability—face a steepening cliff: market share erodes first, then pricing power, then brand relevance.
For you as a buyer, this competitive pressure is genuinely good news. It is already producing price cuts, longer warranties, and faster software improvements across the segment.
What the Market Trajectory Means for Your Next Vehicle Decision
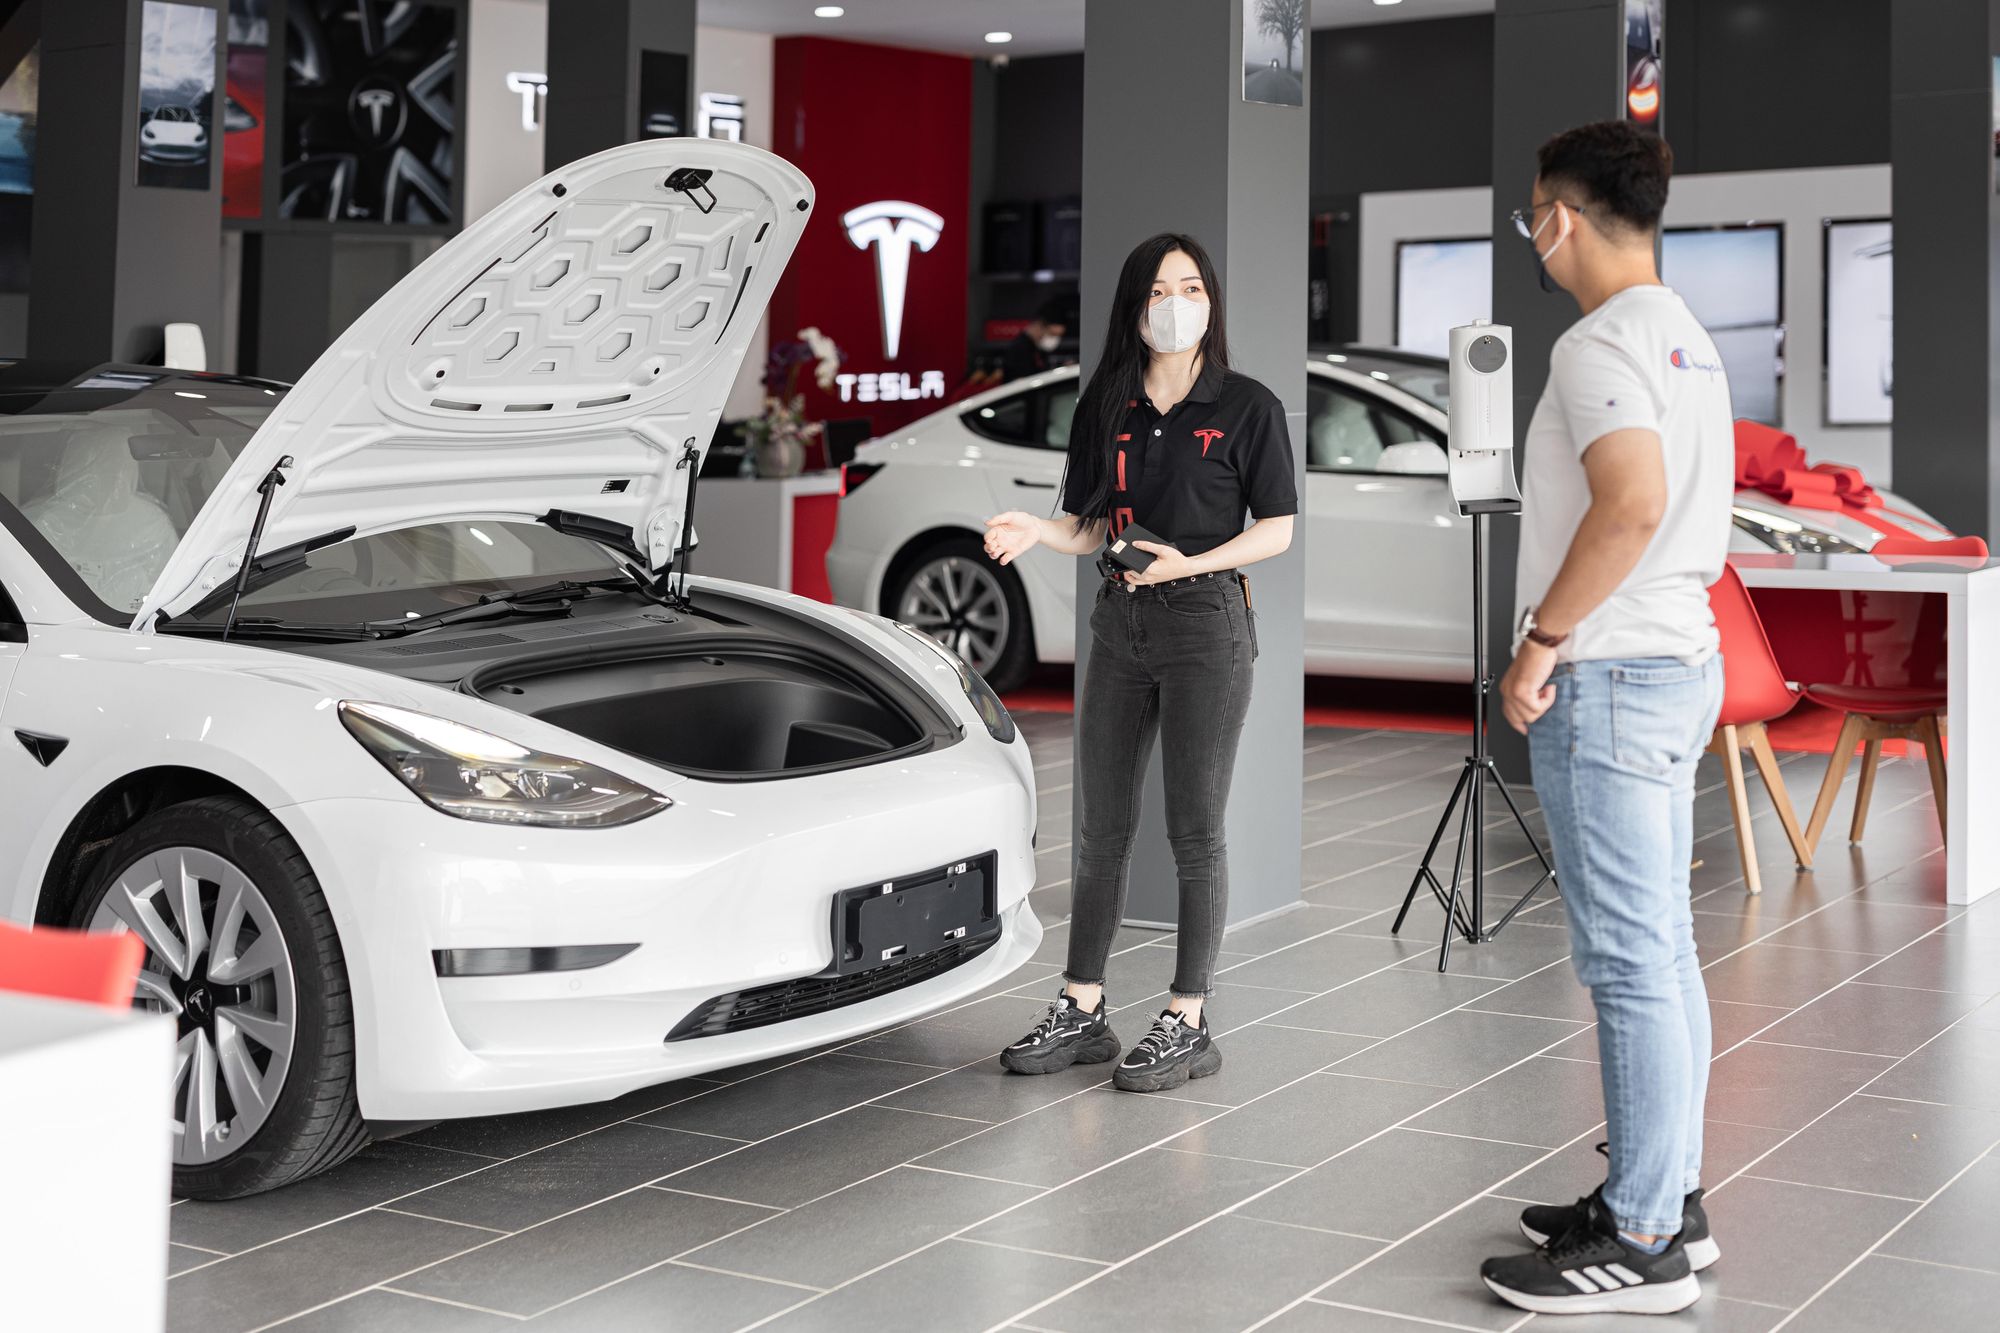
Understanding the EV market’s size and direction isn’t just macroeconomic background noise—it has direct, practical implications for when and what you buy.
If you’re buying in the next 12 months, you’re entering the market at peak competitive pressure. Incentives, lease deals, and list-price reductions are more aggressive right now than they will be once the field thins to a handful of dominant platforms. Use that leverage.
On reliability, be clear-eyed about the trade-offs. EV-native brands carry stronger over-the-air fix capability—many issues that would require a dealer visit on a legacy vehicle get resolved remotely overnight. But traditional automakers often maintain denser physical service networks, which matters if you live in a rural area or need collision repair. Weigh both factors against your geography and actual driving profile.
On total cost of ownership, the math is increasingly favorable. Electricity costs run roughly one-third of equivalent gasoline spend in most U.S. and European markets. That gap is compressing the payback window on a higher upfront purchase price faster than most buyers expect.
On timing, the segment growing fastest right now is mid-size SUVs and pickup trucks. If that’s your category, expect a significant wave of new EV entries between 2025 and 2028. Waiting one model year in this segment frequently gets you meaningfully more range, faster charging, and better technology per dollar spent.
Key Specs to Benchmark Before You Shop
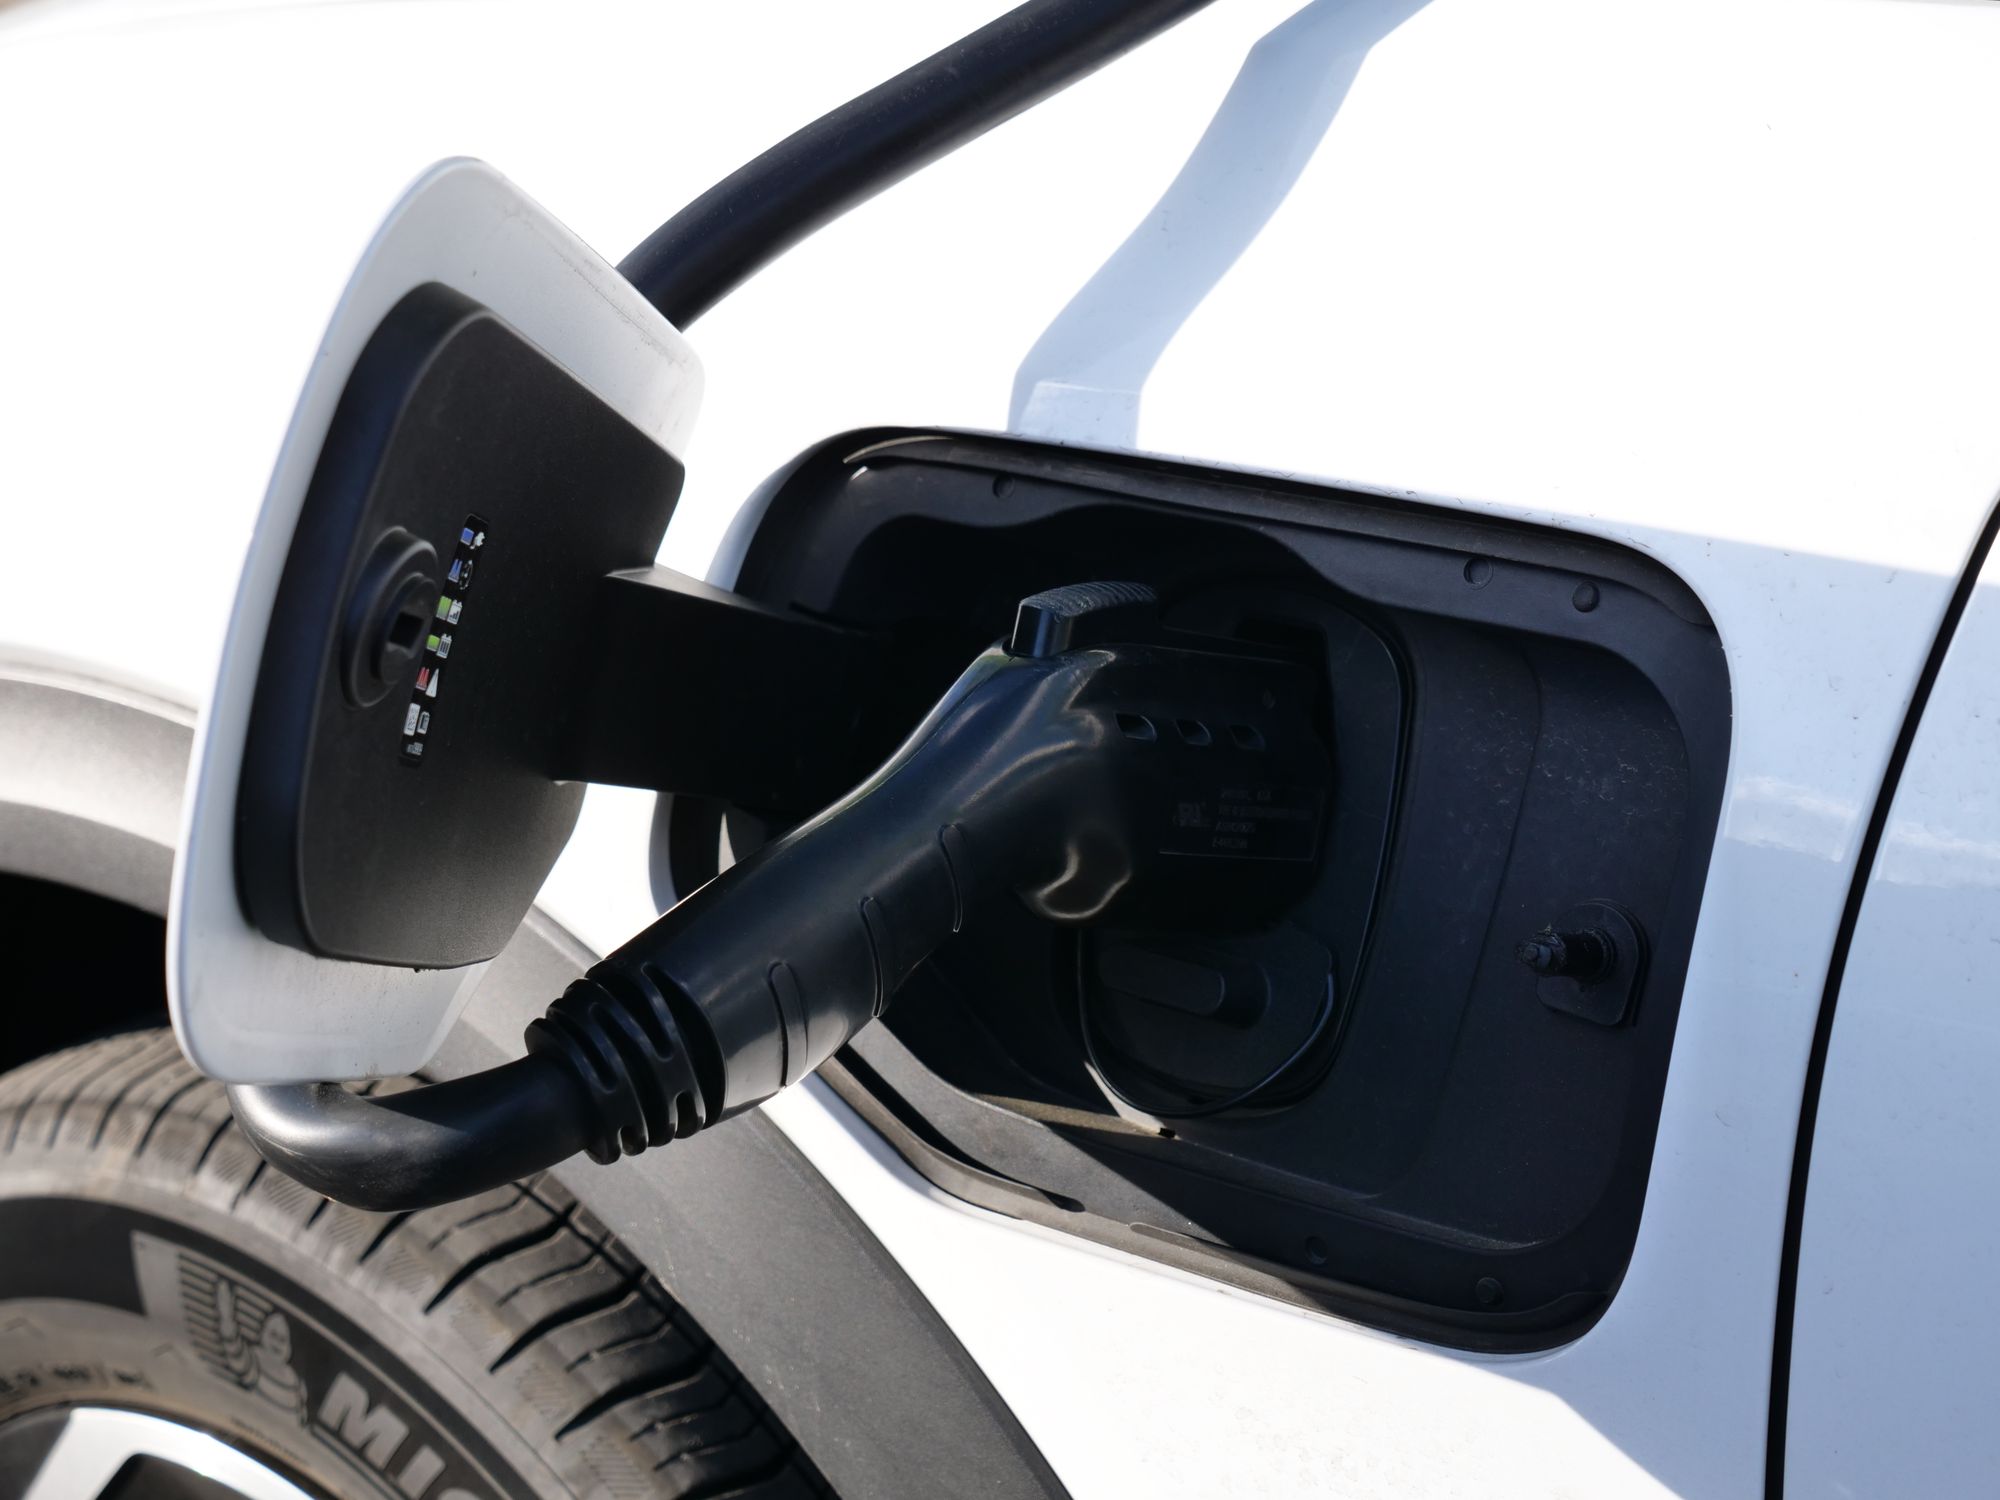
Before you walk into a showroom or configure anything online, anchor yourself to these reference points so marketing language doesn’t obscure the real differences between vehicles:
- Range: 250 miles EPA-rated is the current floor for genuine daily usability without constant mental overhead. At 300-plus miles, range anxiety effectively disappears for the majority of drivers and use cases.
- DC fast-charge speed: Look for 150 kW minimum. That delivers roughly 150 to 200 miles of added range in 20 to 30 minutes—the threshold that makes road trips genuinely practical rather than merely possible on paper.
- Efficiency (MPGe): The EPA’s MPGe rating gives you a direct energy-cost comparison across vehicles. Higher is better, and the differences compound meaningfully over a five-year ownership period.
- Battery warranty: Eight years and 100,000 miles is the federal minimum in the U.S. Leading brands now offer 10 years and 150,000 miles. That gap has a material impact on resale value and long-term cost exposure—it is not a minor footnote buried in the fine print.
The Bottom Line: Growth Is Confirmed, Timing Is the Variable
Every credible forecasting organization—Grand View Research, BloombergNEF, Fortune Business Insights, and Statista—agrees on the direction of travel. The only live debate is whether the 50% global sales-share crossover lands closer to 2033 or 2035. For legacy automakers, a two-year forecasting error at this scale is an existential difference—it separates a managed transition from a crisis. For you as a buyer, it simply means competitive pricing and accelerating technology for at least the next five years, regardless of how the forecasts ultimately resolve.
The trillion-dollar headline figures are a symptom, not the story. The story is that the internal combustion engine’s majority position in global new-car sales is almost certainly ending within this decade—not at the end of some distant policy horizon, but within the lifespan of the vehicle you are shopping for right now.
Your move: use this competitive window to negotiate harder, demand better warranty terms, and prioritize brands with demonstrated software depth and real charging infrastructure commitments. Brands still treating EVs as a side project while their core business burns gasoline are not where you want to park long-term loyalty—or long-term money.