
The world’s best-selling electric car title has already changed hands twice since late 2024, and according to a Bloomberg report dated July 1, 2026, it’s about to flip again. If you’re buying, owning, or even just considering an EV, that back-and-forth affects your wallet more directly than most automotive headlines do.
The Scoreboard Has Flipped More Than Once — And Why That Matters
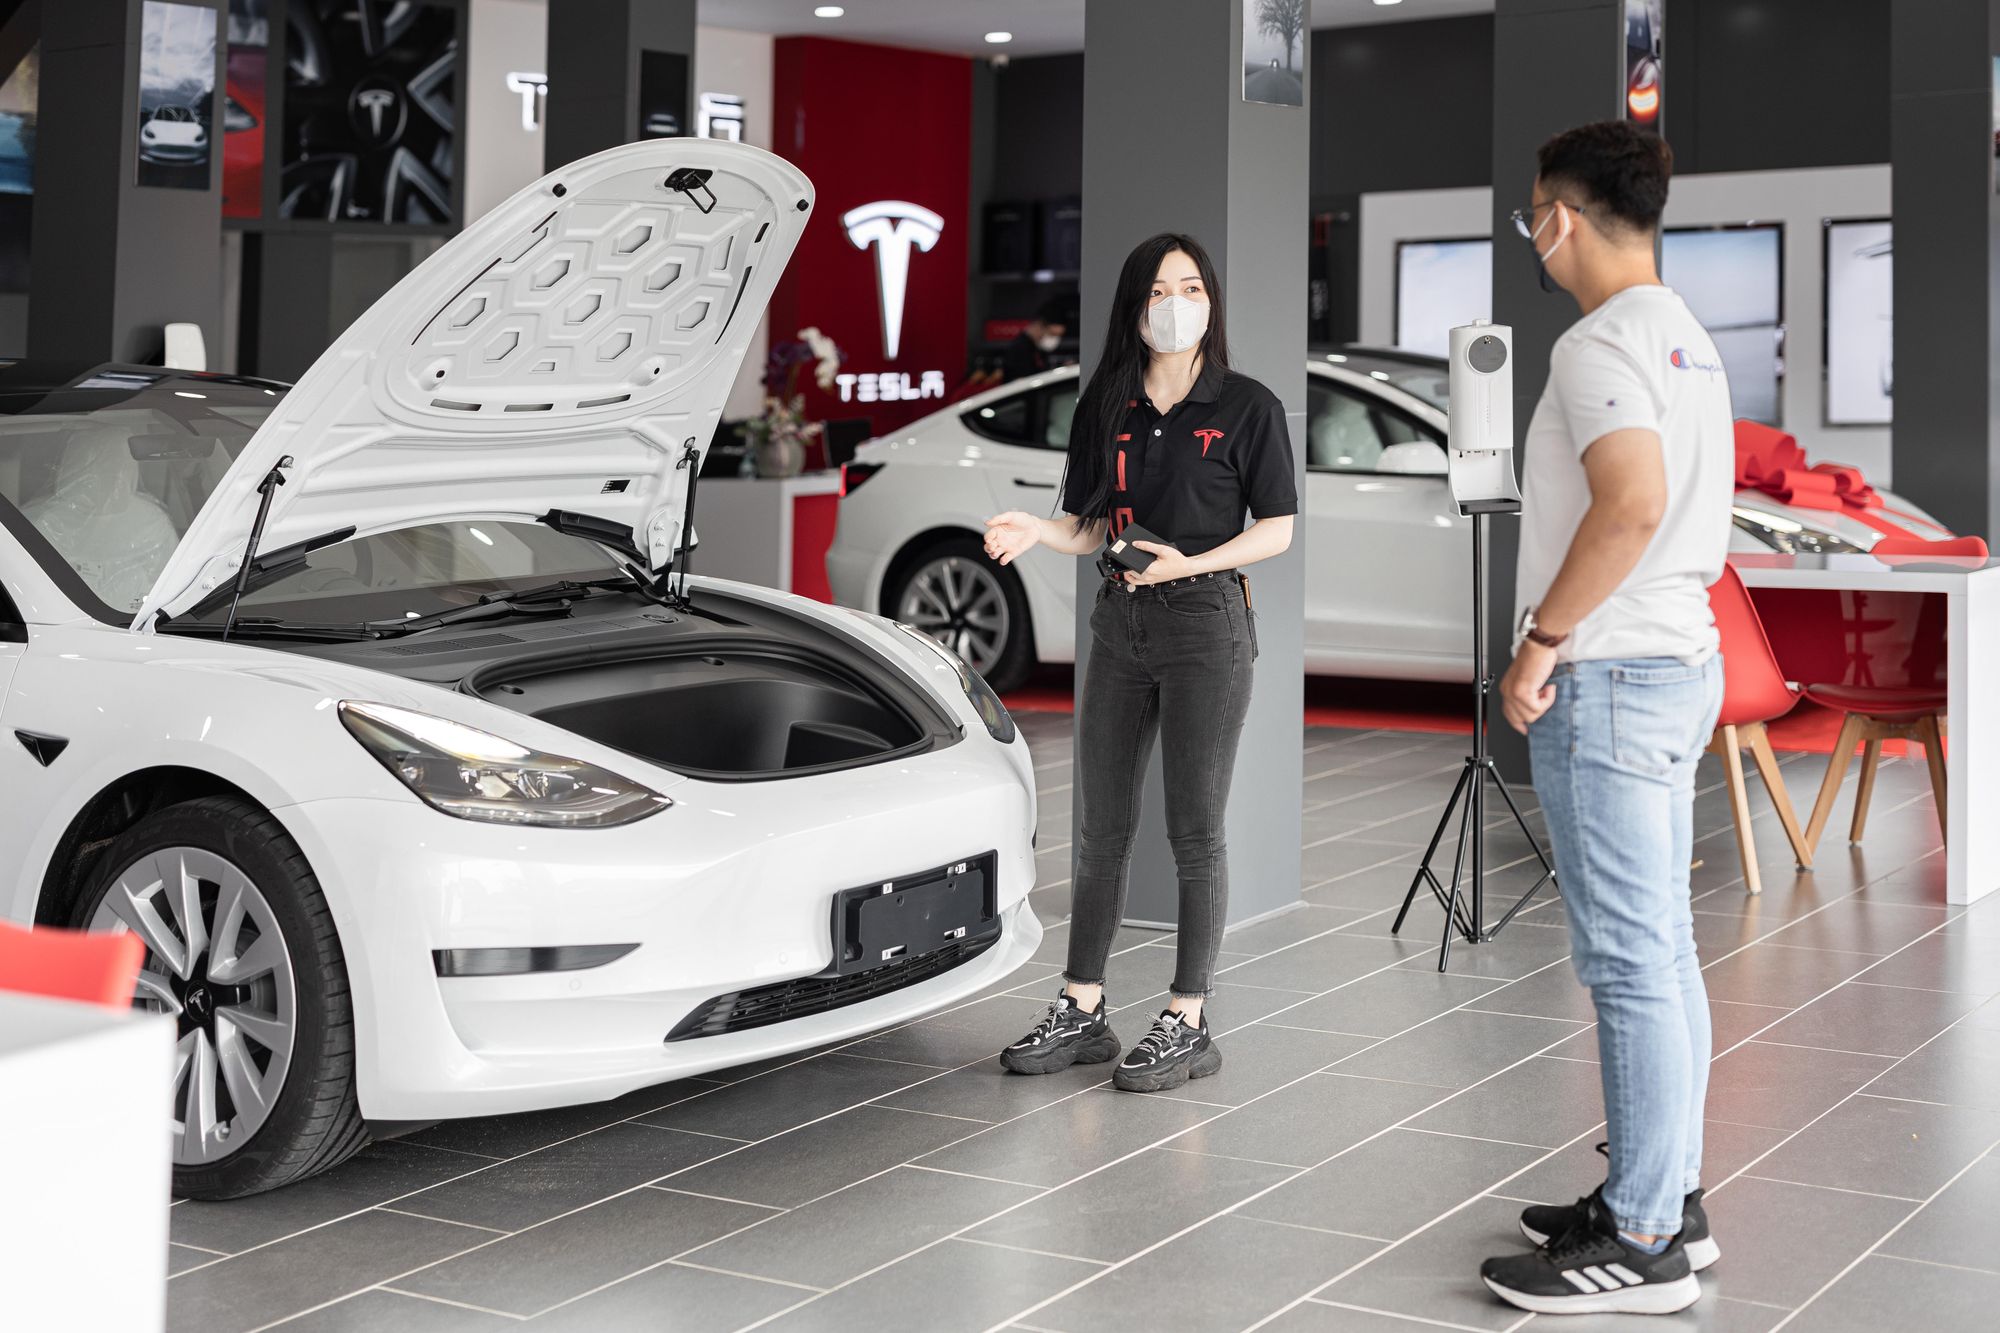
This isn’t a one-off upset. BYD first outsold Tesla in fully electric vehicles in Q4 2024 — an event the BBC described as “the first time it has outpaced” Tesla — then held that lead throughout all of 2025. Tesla clawed back the top spot in Q1 2026, outselling BYD by roughly 48,000 units. Now, as of July 2026, BYD is poised to reclaim the crown again. That’s three lead changes in under two years. This is a genuine rivalry, not a quarterly anomaly.
Markets are treating it seriously. BYD’s shares jumped 8.4% on the July 2026 announcement — its biggest single-day gain in recent memory. When institutional money moves that sharply on a sales-ranking shift, it signals something structural, not ceremonial. The competition between these two companies is actively shaping pricing pressure, charging infrastructure investment, and the pace of new model launches. All of that flows downstream to consumers.
The Numbers Behind the Headline: 2024-2026 at a Glance
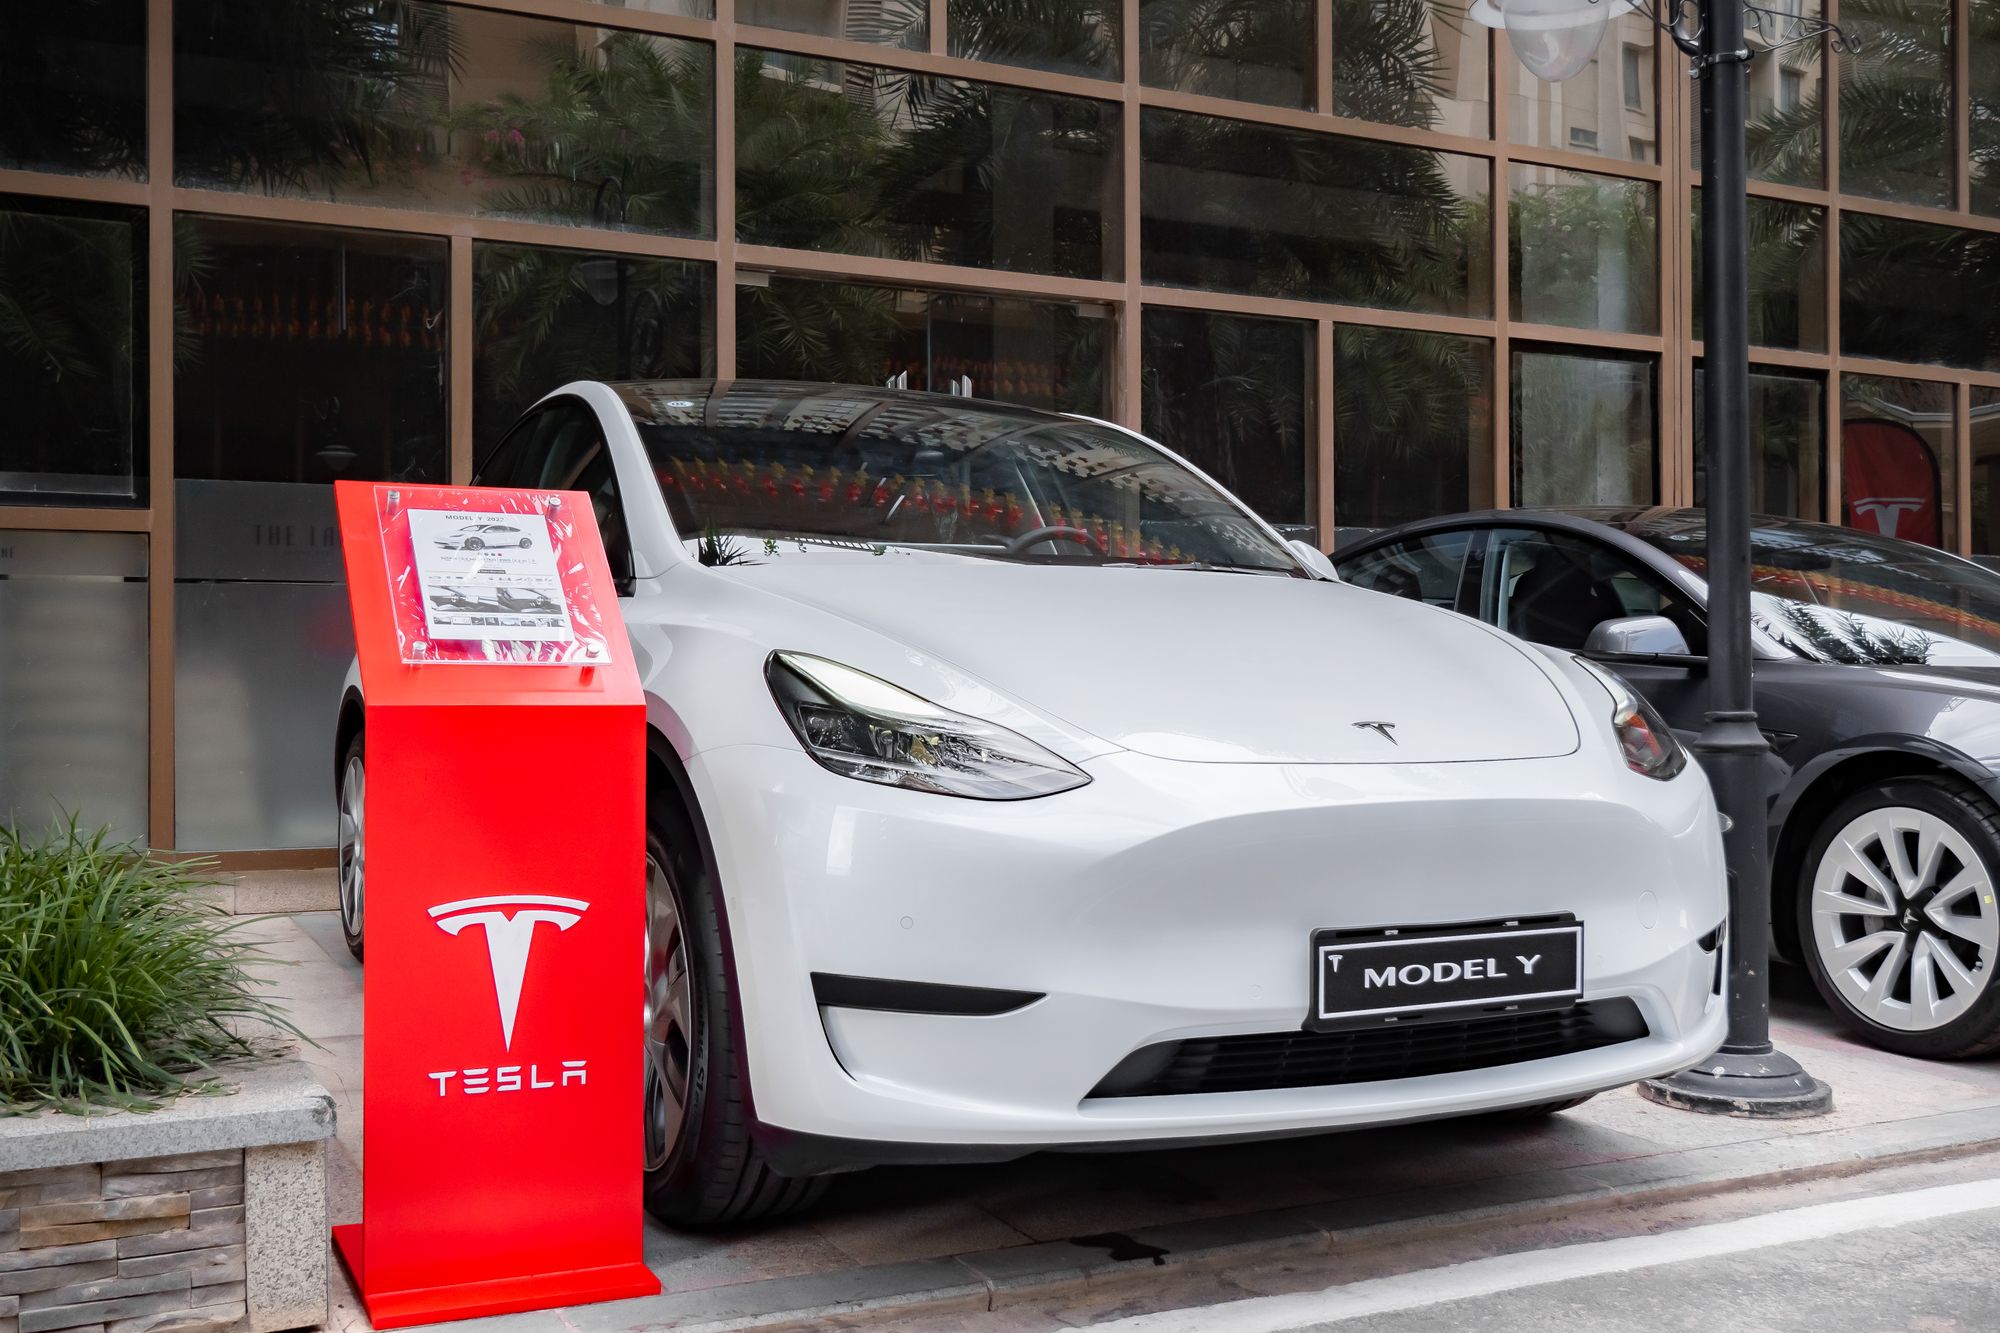
The raw figures tell a story of two companies moving in opposite directions at speed. BYD sold 2.26 million battery-electric vehicles in 2025, a nearly 28% year-on-year increase. Tesla’s deliveries dropped 8% over the same period. When one competitor grows at that rate while the other contracts, you’re not looking at a coin-flip rivalry — you’re looking at a structural shift in momentum that Q1 2026’s brief Tesla comeback barely interrupts.
Context matters on that Q1 2026 reversal. Tesla’s 48,000-unit margin sounds meaningful until you place it against annual volumes in the millions — it was a sprint win inside a marathon BYD was leading on aggregate. And it wasn’t driven by a Tesla surge so much as a BYD stumble: softening consumer demand inside China, BYD’s core domestic market, was the primary drag on its numbers that quarter. A single country’s economic sentiment temporarily shifted a global sales crown. That tells you how tight the margins really are, and how volatile the headline will continue to be.
Why the Lead Keeps Switching: The Structural Drivers
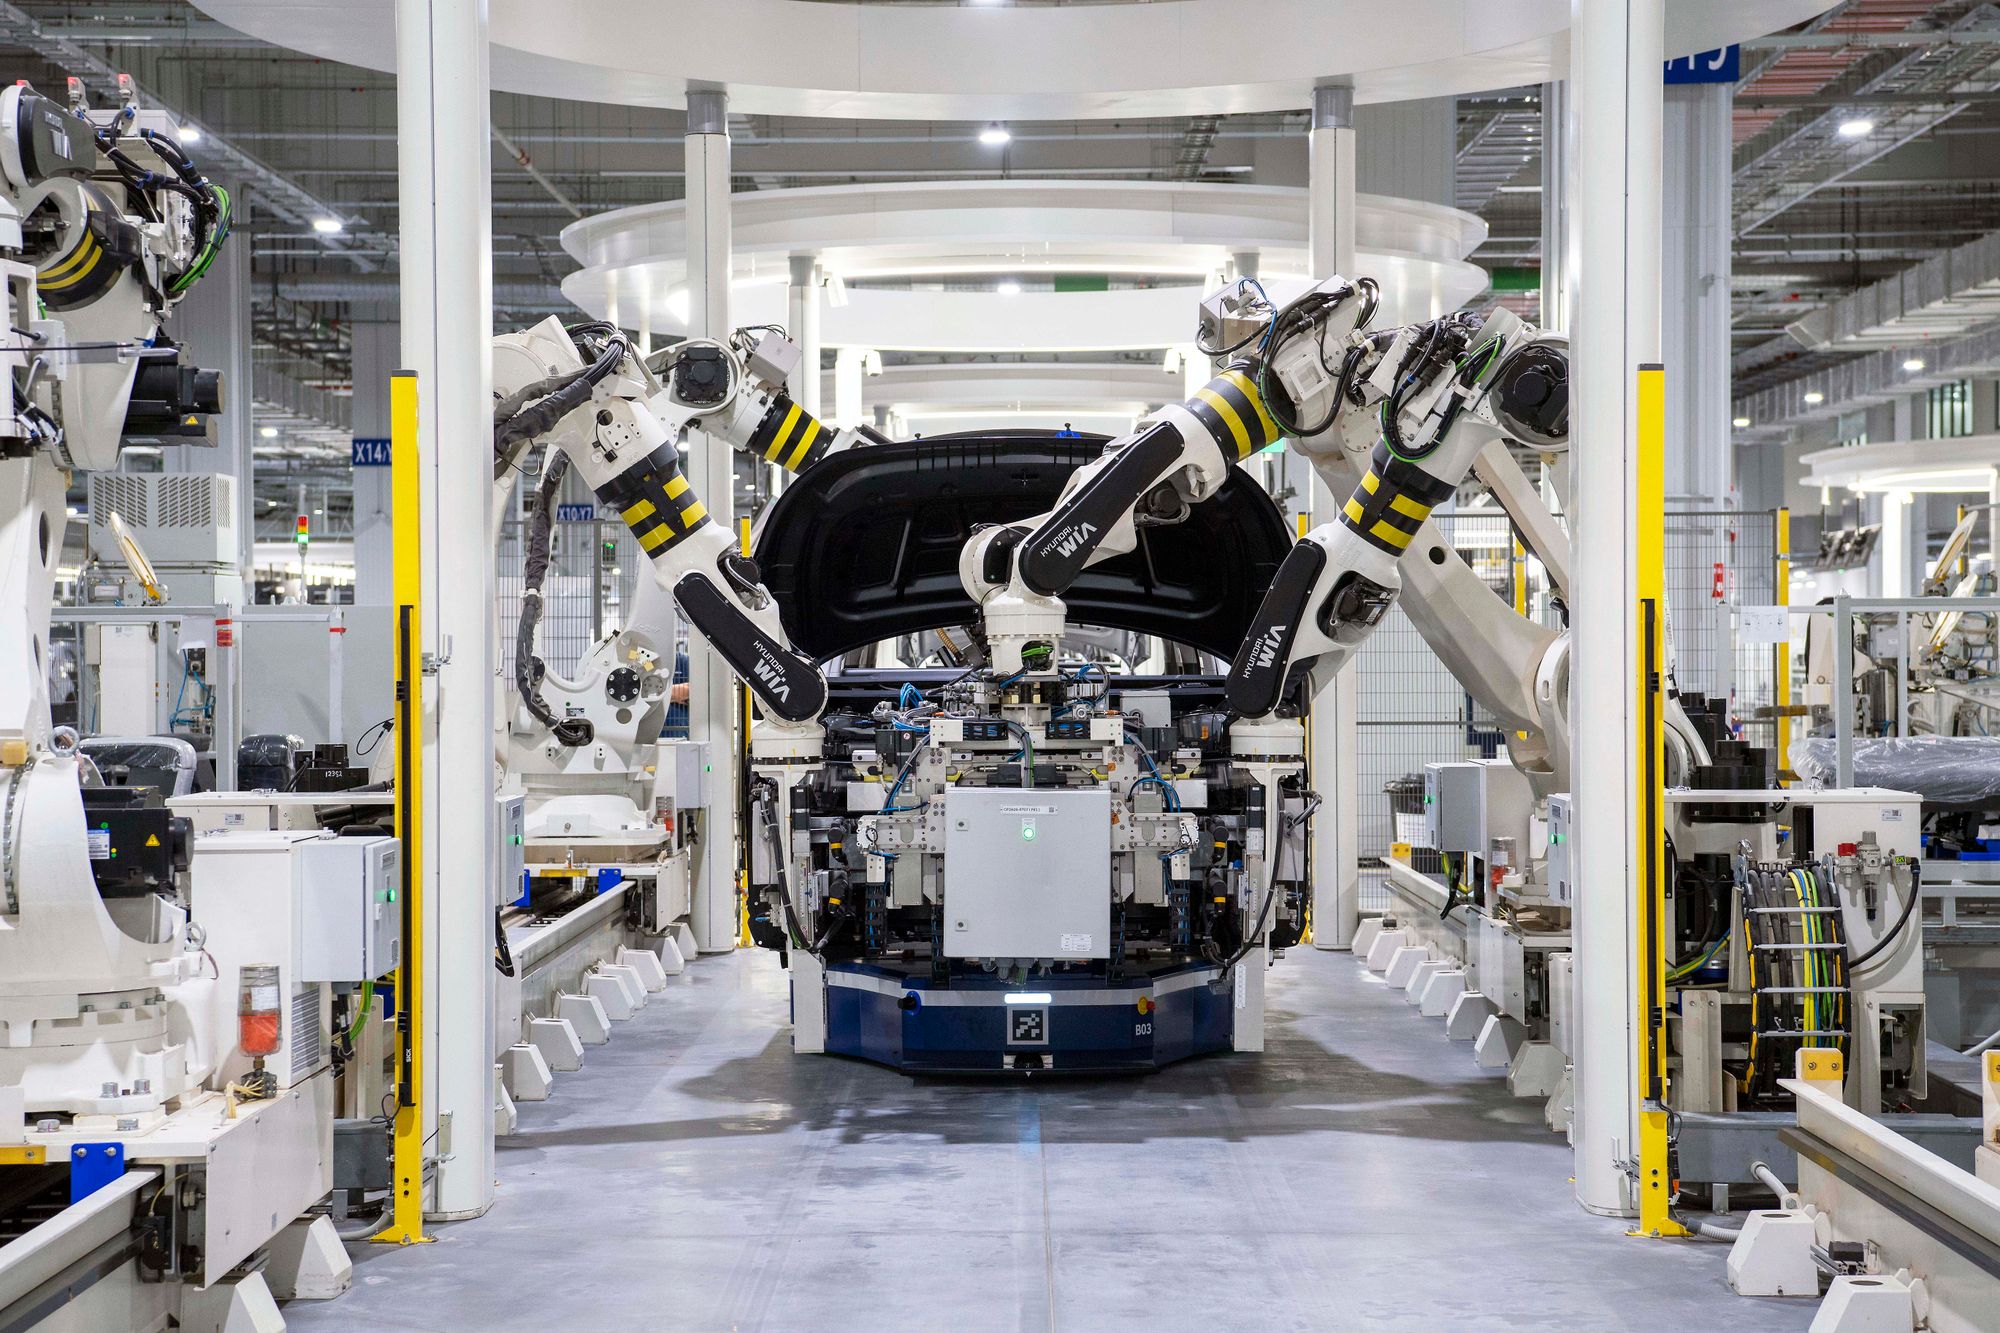
BYD’s core advantage is vertical integration. It manufactures its own batteries, chips, and motors in-house, giving it a cost floor Tesla — which depends on external suppliers for key components — cannot easily match. When a market softens, BYD can discount aggressively without destroying margins the way a parts-dependent automaker would. That structural flexibility is why BYD can absorb a bad quarter in China and still compete aggressively on price in export markets.
Tesla’s Q1 2026 lead was partly a BYD problem, not purely a Tesla achievement. Tesla’s own 8% delivery decline through 2025 confirms the brand has demand challenges of its own in key Western markets — an aging model lineup, brand-perception headwinds in Europe, and a Cybertruck that hasn’t moved the volume needle at scale. The Supercharger network and over-the-air software ecosystem remain genuine competitive moats in North America and Europe, keeping a loyal renewal base intact. But loyalty doesn’t compensate for declining new-customer acquisition, and that’s the gap Tesla needs to close.
BYD’s global expansion into Europe, Southeast Asia, Latin America, and Australia remains early-stage. As those markets mature and BYD’s volume base spreads across more geographies, quarterly swings driven by China’s domestic sentiment will shrink. The lead changes will become less volatile — and BYD’s aggregate advantage will likely consolidate over time.
What It Means for EV Prices: The Competitive Pressure You Benefit From

Here’s the part that hits budgets directly. Every time BYD has closed the gap on Tesla’s sales figures, Tesla has historically responded with price cuts. The 2023 and 2024 rounds of Model 3 and Model Y reductions were timed closely to BYD’s rising global market share — that’s not coincidence, that’s competitive pricing mechanics at work.
BYD’s entry-level models in China — the Seagull and Dolphin — undercut Tesla’s cheapest offering by a wide margin. As BYD pushes these platforms into Western markets, local pricing benchmarks shift downward for the entire segment. Legacy competitors notice. Volkswagen, GM, and Hyundai-Kia all repositioned EV pricing during the period BYD held the 2025 global sales lead. The competitive cascade runs well beyond the two headline brands.
The practical takeaway for buyers is this: the closer BYD gets to Tesla in global share, the more negotiating leverage you have at a Tesla configurator or dealership, and the more aggressively BYD prices its own export models to establish market position. The flip side matters equally — if one brand pulls decisively ahead and the other retreats from the premium segment, pricing pressure eases. Sustained rivalry is better for your budget than a monopoly outcome.
Head-to-Head: What the Specs and Real-World Numbers Actually Show

Sales rankings matter less to your buying decision than what’s on the spec sheet. Here’s a direct comparison of leading models from each brand across the metrics that actually affect ownership:
| Metric | BYD Atto 3 / Seal | Tesla Model Y / Model 3 |
|---|---|---|
| MSRP range (approx.) | £32,000-£45,000 (UK); varies by market | £40,000-£55,000 (UK); varies by market |
| Real-world range | 220-300 miles depending on model and conditions | 280-340 miles depending on variant and conditions |
| Peak charge speed | Up to 150 kW (Seal); 80 kW (Atto 3) | Up to 250 kW (Supercharger V3) |
| Cargo volume | Atto 3: 440L boot; Seal: 400L boot + 50L frunk | Model Y: 854L total; Model 3: 594L total |
| Battery warranty | 8 years / 150,000 km | 8 years / 100,000-150,000 miles (varies by variant) |
| Charging network access | Public CCS / CHAdeMO (market-dependent) | Proprietary Supercharger + CCS adapter |
Tesla still leads clearly on charging network size and software update frequency. If your regular routes take you across unfamiliar territory, that network density is a real-world advantage, not a marketing point. BYD leads on upfront price-per-mile-of-range in most markets where both brands are sold side by side.
The most important gap to name honestly is reliability data. Tesla has years of independent owner surveys from J.D. Power and Consumer Reports in Western markets — the picture is mixed, but the data exists and is publicly readable. BYD’s Western-market reliability record is simply too short to draw firm conclusions. That’s a genuine trade-off, not a minor caveat. If long-term reliability certainty matters more to you than upfront cost savings, that asymmetry in available data is reason for caution.
A practical decision framework: choose Tesla if you prioritise software capability, charging infrastructure on your specific routes, and resale value certainty in your market. Choose BYD if upfront cost, battery warranty terms, and features-per-dollar are your primary filters — and if you’re comfortable being an earlier adopter of a brand still building its Western service network.
What Happens to the Broader EV Market Each Time BYD Takes the Crown

The ripple effects extend well beyond two brands. When BYD held the global EV sales lead through 2025, legacy automakers accelerated their own EV price repositioning. The competitive cascade is real and it moves fast. BYD reclaiming the top spot in July 2026 will apply that same pressure again.
BYD’s growing global market share also forces charging-network operators and grid planners to account for a non-Tesla dominant standard. That accelerates the broader push toward CCS and GB/T compatibility, which benefits every EV owner regardless of brand — more universal infrastructure is better infrastructure. A market where a single proprietary connector dominates is a market where one company controls a chokepoint. The more BYD grows, the less likely that outcome becomes.
Investor capital follows the sales leader. BYD’s 8.4% single-day share gain signals that institutional money views the title as a proxy for long-term market position. R&D budgets across the industry respond to that signal. Competition at the top accelerates innovation timelines for every brand below it.
The Bottom Line: What to Watch — and What to Do — Right Now
BYD’s trajectory — nearly 28% volume growth while Tesla contracts 8% — points toward a structural shift in the global EV market, not a quarterly blip. If you’re buying an EV in the next 12 months, BYD’s expanding model range deserves a serious test drive, not just a passing glance. The brand is no longer a niche alternative; in several major markets it is already the mainstream choice by volume.
Watch Tesla’s Q2 and Q3 2026 delivery reports. If the gap widens toward BYD by more than 100,000 units over two consecutive quarters, expect another round of Tesla price adjustments in the US and European markets — which means waiting a quarter could save you money if you’re flexible on timing. The trajectory heading into mid-2026 suggests that scenario is more likely than not.
What you shouldn’t do is make a purchase decision based on who’s winning the sales race this quarter. Make it on real-world range on your actual routes, charging access where you actually drive, total cost of ownership over five years — including energy costs, insurance, and servicing — and residual value in your specific regional market. Those numbers matter more than any quarterly leaderboard.
The rivalry itself, though, is genuinely good for buyers. Sustained, close competition between the world’s two largest electric-car makers is the most reliable mechanism the market has for driving prices down and quality up. The best outcome for EV buyers isn’t a decisive winner — it’s a race that stays close enough to keep both companies uncomfortable.