
Arlington County, Virginia is moving to raise public EV charging rates at its government stations — and the pricing logic behind that decision is already spreading to networks nationwide. If you charge an electric vehicle away from home with any regularity, the math you’re using to justify your ownership costs may be about to change. Here’s what the Arlington proposal actually means, what public charging really costs versus home charging, and where your cost advantage as an EV driver starts to erode.
What Arlington Is Proposing and Why It Matters Beyond Virginia

The Arlington County Board is considering a proposal to raise EV charging rates at its public stations from the current interim rate of $0.1452 per kilowatt hour to approximately $0.19/kWh. That is a jump of roughly 4.5 cents per kWh, or about 26 percent. The supporting materials for the proposal are available in the county’s public meeting records, and they make the rationale explicit: the current rate was always a placeholder, set while the county collected real usage data before committing to a sustainable long-term price.
That word — interim — is doing a lot of work. Municipal charging programs routinely launch at below-cost rates to encourage adoption, then reprice once they have operational data and a clearer picture of infrastructure costs. Arlington is not unusual in this approach; it is simply further along in the cycle than many peer jurisdictions. The county has signaled in its own materials that further adjustments are possible after this round, which means the new $0.19/kWh rate should not be read as a ceiling. It should be read as a direction.
The broader pattern is what makes this locally specific story worth national attention. Public charging networks built on federal grants, municipal bonds, and utility subsidies are aging into cost-recovery mode. The infrastructure debt is coming due, and the mechanism for paying it is per-kWh rate increases. Arlington is an early and transparent example of a repricing wave that is already moving across other markets.
What the Rate Hike Costs at the Charger

Put the numbers in terms of a real charging session. At the current $0.1452/kWh interim rate, filling a 60 kWh battery from near-empty costs approximately $8.71. At the proposed $0.19/kWh rate, that same session costs approximately $11.40 — a difference of $2.69 per fill-up.
That difference compounds quickly. A driver who charges publicly twice per week would absorb roughly $280 in added annual costs from this single county’s rate change alone. If you are using multiple networks across multiple jurisdictions and several of them follow Arlington’s lead over the next 12 to 18 months, the cumulative impact on your annual fuel budget becomes significant. The era of cheap or subsidized public charging as a selling point for EV ownership is ending, and prices are beginning to reflect what the infrastructure actually costs to build, maintain, and operate.
The National Baseline: What EV Charging Actually Costs — and What the Averages Hide

Understanding why Arlington’s hike matters requires understanding what national averages actually measure. The nationally cited average cost for a full 60 kWh charge runs approximately $2.18, and the average cost per mile for EV charging is often cited at around 1.1 cents nationally. Those figures are real, but they are heavily weighted toward home charging rates rather than public hardware prices.
At home, the average EV owner spends approximately $61.21 per month on electricity for their vehicle. That is dramatically cheaper than any public Level 2 or DC fast charger on a per-kWh basis. The frequently cited figure of roughly $227 in annual fuel savings for EV drivers compared to comparable gas vehicle drivers holds only if the overwhelming majority of charging happens at home overnight. It does not hold if public charging is your primary or even a substantial secondary strategy.
Home vs. Public Charging: The Side-by-Side Numbers

The cost gap between home and public charging is wide enough that it should factor into every EV ownership decision. Home charging at the U.S. residential average delivers approximately 1.1 cents per mile. Public Level 2 charging at the proposed Arlington rate pushes that closer to 1.6 cents per mile. DC fast chargers — the stations you rely on for road trips — routinely run $0.35 to $0.50/kWh, which translates to 3 to 4 cents per mile and can make a 60 kWh fill cost $21 to $30. At those prices, the gap between driving electric and driving on gasoline closes substantially and, depending on your local gas prices, can disappear entirely.
The break-even threshold is worth stating plainly. If more than roughly 30 to 40 percent of your charging happens publicly at elevated rates, your annual savings over gasoline shrink toward zero. Using DC fast charging as a primary fuel source essentially eliminates the cost advantage of EV ownership. That is not an argument against electric vehicles — it is an argument against building your cost assumptions on the wrong infrastructure tier.
For a detailed breakdown of EV charging costs by state and charging type, the variation across markets is significant enough that your local rate environment should inform your charging strategy before you commit to it.
Charging Cost Comparison: Home, Public Level 2, and DC Fast

| Charging Type | Rate (per kWh) | Cost per 60 kWh Fill | Cost per Mile (est.) | Monthly Cost (avg. driver) | Key Trade-off |
|---|---|---|---|---|---|
| Home Level 1/2 (U.S. residential avg.) | ~$0.13 | ~$7.80 | ~1.1¢ | ~$61.21 | Lowest cost by a wide margin; requires dedicated outlet or EVSE installation and overnight dwell time |
| Public Level 2 (Arlington proposed rate) | ~$0.19 | ~$11.40 | ~1.6¢ | Varies by session frequency | Approximately 46% more expensive per kWh than home; practical for workplace charging and errands |
| DC Fast Charging (national range) | $0.35-$0.50 | $21-$30 | 3-4¢ | Varies widely | Essential for long-distance travel; regular use as primary charging source eliminates EV cost advantage |
The table makes the decision framework clear. Home charging dominates on cost by every measure. Public charging is a supplement to a home-charging strategy, not a substitute for one — unless your housing situation gives you no alternative.
Who Feels This Most and Who Can Largely Ignore It
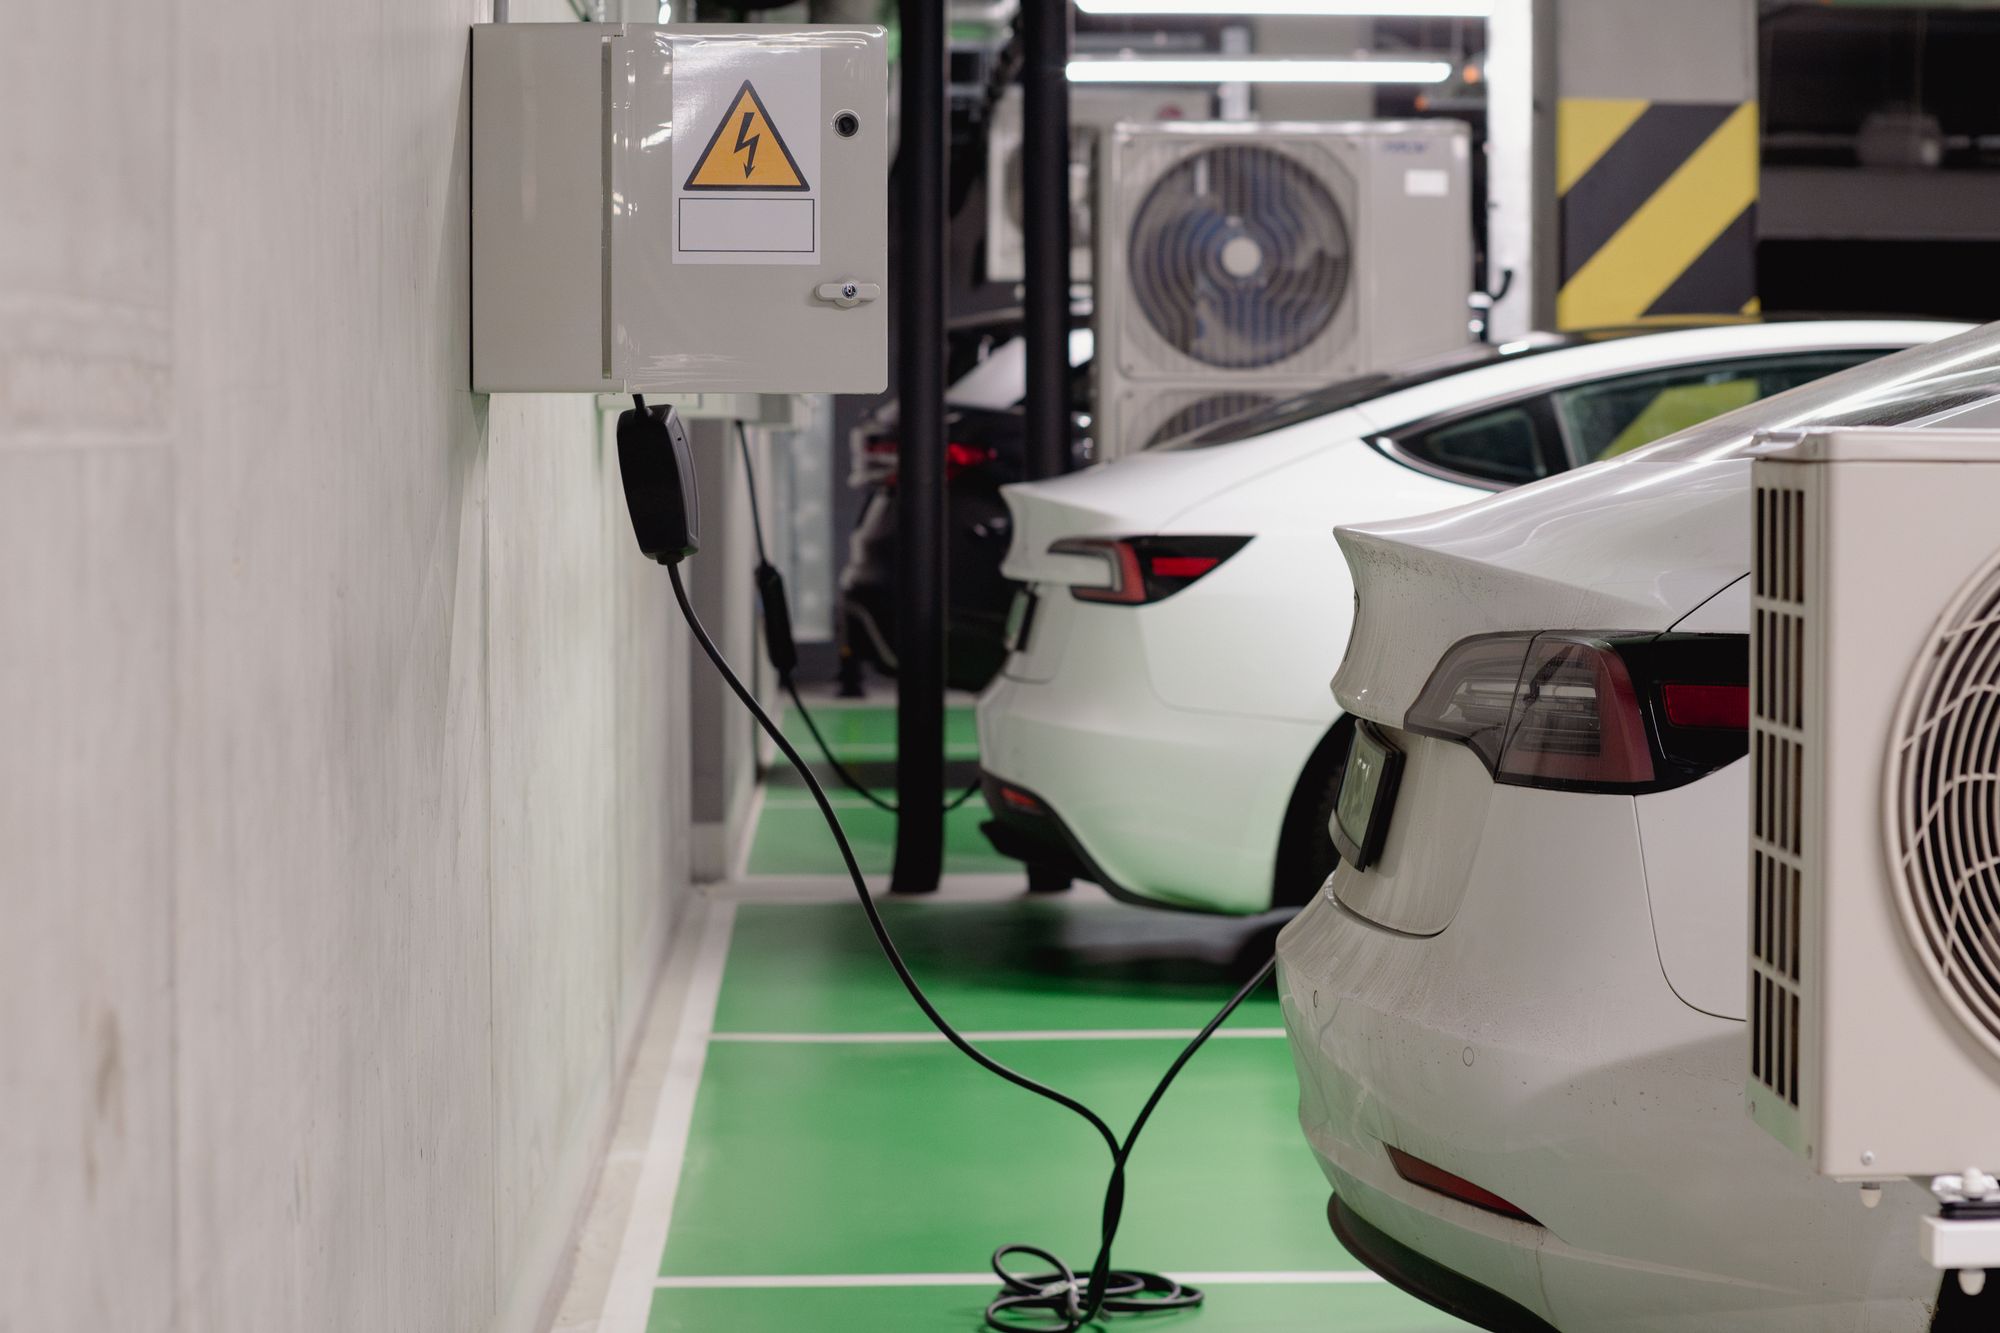
Not every EV driver is equally exposed to rate hikes like Arlington’s. If you have a Level 2 home charger and use public stations only for occasional top-offs on long driving days or road trip legs, a change like this is an annoyance, not a budget event. Your cost structure does not change materially.
Three groups need to pay close attention. First, apartment and condo residents without dedicated parking or charging access: if you have no home charger, public rates are not your backup plan — they are your entire fuel supply. Every rate increase hits you proportionally harder than it hits a homeowner with a garage. Second, urban drivers in markets where Level 2 public stations represent the primary option face compounding exposure as multiple networks and municipalities raise rates in sequence over time. Third, fleet operators and ride-share drivers who log high daily mileage on public networks need to model the new per-kWh economics immediately. A 26 percent input cost increase on a tight-margin operation is not a wait-and-see situation.
What to Do With This Information
If home charging is accessible to you, installing a Level 2 EVSE is the most durable response to public rate increases. The payback period on the hardware shortens every time a public network raises its prices, and locking in a home charging cost of roughly $61.21 per month — or less, depending on your local electricity rate — creates a floor that public-only drivers cannot match even at today’s prices.
Track your public-versus-home charging split over the next 30 days using your vehicle’s onboard energy data or a third-party app. Most drivers underestimate the share of energy that actually comes from public stations. Seeing the real number sharpens how you think about rate hikes like Arlington’s and whether your current strategy still makes financial sense.
When evaluating an EV purchase or reassessing ownership costs, treat public charging as a scenario to model explicitly, not an edge case to dismiss. Ask what your annual fuel cost looks like if 25, 40, or 60 percent of your charging happens at $0.19 to $0.35/kWh rather than your home rate. The answer may not change your decision, but it should inform it.
Finally, monitor the rate pages of your local municipality’s charging program and the pricing sections of whichever networks you use most. Arlington is not acting in isolation — it is acting first and transparently. A 26 percent increase with further adjustments flagged as likely is a concrete preview of what is coming to stations near you. The time to build your home charging infrastructure and reset your cost expectations is before the next round of increases arrives on your session receipt.